Impurities in the ice matrix: Where are they, and why does it matter?
The impurities contained in ice impact its physical and chemical properties. To understand this impact, and therefore improve ice-derived climate reconstructions, it is critical to determine the location and nature of impurities in the ice matrix.
The Earth’s glaciers and the Antarctic and Greenland ice sheets store a vast amount of information about its climate history. Within the ice, alongside preserved pockets of Earth’s past atmospheres and the temperature record detailed in the isotopic ratios of water molecules, impurities provide additional insights into the past. These impurities can be diverse in origin and composition, such as dust particles carried from Patagonia to Antarctica (Basile et al. 1997), ash from Icelandic volcanoes reaching Greenland (Wittmann et al. 2017), and salt aerosols originating from open waters and the surface of sea ice (Rhodes et al. 2017). These impurities are analyzed to investigate past atmospheres’ aerosol composition, the physical properties of ice, and many other subjects (Stoll et al. 2021). While analysis of meltwater has proved an excellent approach to extracting such information from ice, melting ice causes the loss of spatial data relating to the location of impurities within the ice matrix. Precise information regarding the location of these impurities within the ice matrix is crucial (Stoll et al. 2022). Understanding the location of impurities within the ice microstructure helps address questions on how to best exploit highly disturbed and thinned ice, such as that targeted at Little Dome C in Antarctica by the Beyond EPICA Oldest Ice Core project, and translate this proxy data into meaningful climate and environmental data. Both microscale processes, such as ice formation from snow, and macroscale processes, such as ice flow, are linked to how impurities are distributed in ice. These post-depositional effects impact the preservation of impurity-derived climate signals by altering the local concentrations and distribution of impurities within the ice. Ice at the bottom of the Antarctic Ice Sheet has highly thinned layers where many thousands of years of ice and impurities can be packed into a single vertical meter. This concentration of information necessitates further advancements in analytical techniques to fully exploit this archive. Work done in the DEEPICE project is developing our understanding of these topics, in part through developments of high-resolution analytical techniques to map impurities in ice. Ideally, any analysis of such ice should be micro-destructive or non-destructive to preserve the ice, enabling further analysis and retention of an archive.
Ice structure and impurity locations
A pure ice crystal is a solid arrangement of water molecules in a hexagonal structure. Glacier ice, formed by the metamorphosis of snow, comprises many such crystals. Structural discontinuities between adjacent crystals are known as grain boundaries (Fig. 1). However, glacier ice is not comprised solely of crystals containing pure water. Impurities are also incorporated in the ice and have been shown to exist both within crystals and at their boundaries (Bohleber et al. 2021). So, how are the locations of impurities in ice samples determined?
|
|
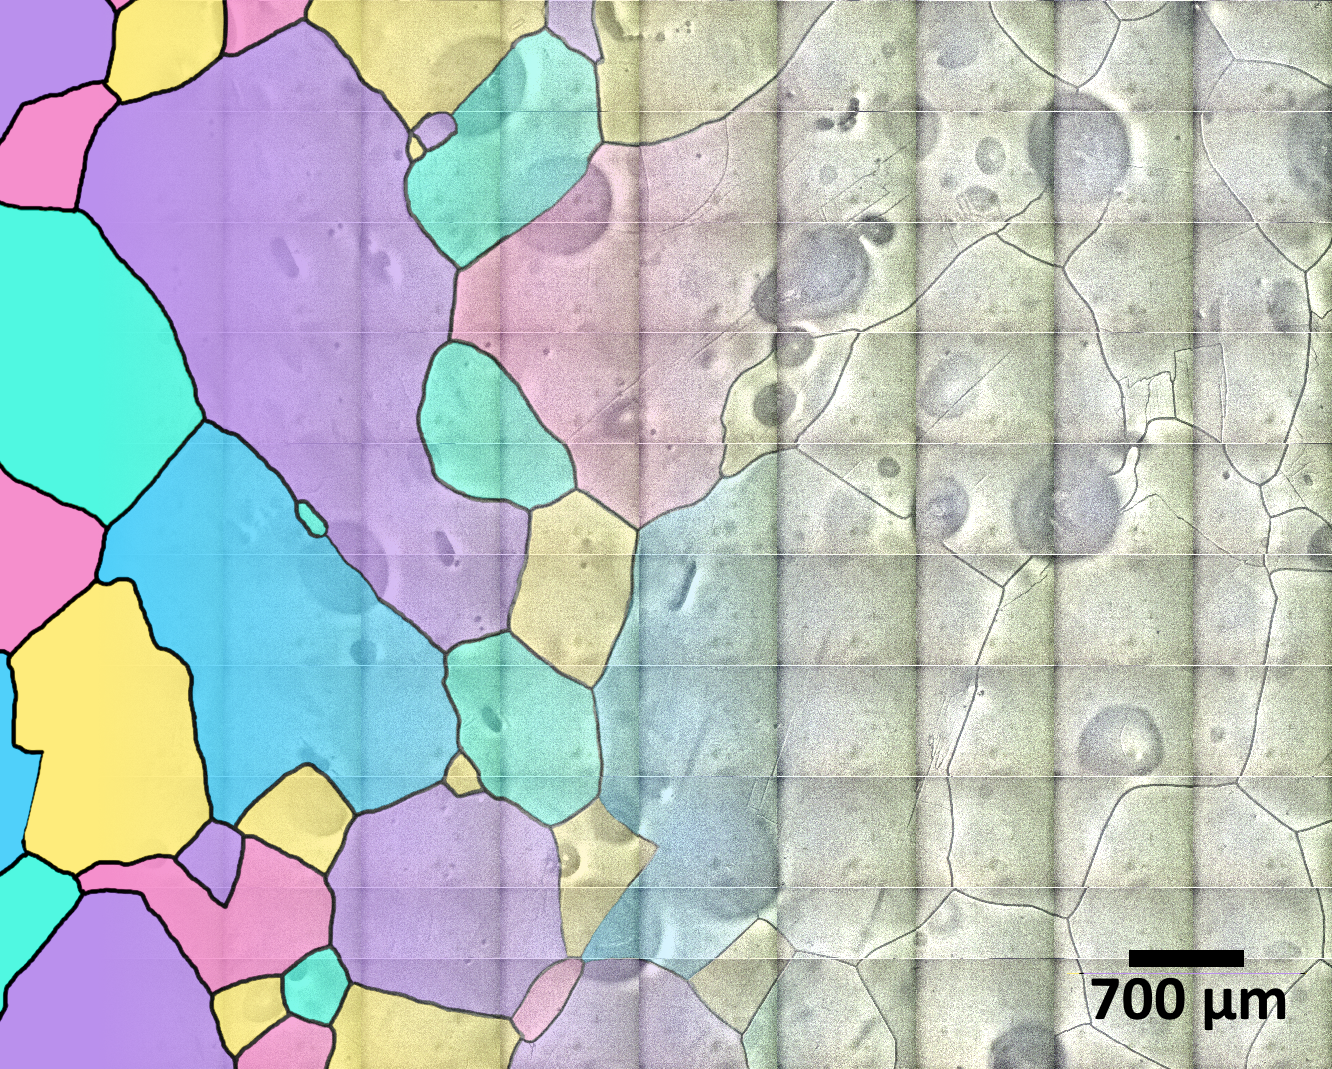
Figure 1: Optical image (right) and illustration (left) of the grain-scale structure of glacier ice collected from talos Dome, Antarctica. Glacier ice is comprised of crystals (represented in different colors in the cartoon section), which can have different orientations. the intersections of crystals (represented by black lines in the cartoon) are known as grain boundaries. Gray rounded features are air bubbles. Impurities are distributed throughout grain- interior and inter-grain regions, as illustrated in Figure 2, which shows the chemical distribution in the same area. Figure modified from bohleber et al. (2021). |
Locating impurities
To enable the analysis of samples in their solid state, and therefore understand the spatial distribution of their impurities, ice samples must be stored and analyzed at stable temperatures of -10°C or lower. Despite this challenge, several techniques have been applied to ice that shed light on the spatial distribution of impurities within the microstructure of ice. These have been discussed in detail in a review by Stoll et al. (2021). These techniques are often coupled with some optical analysis to locate targeted features such as grain boundaries or dust particles in an ice sample. Following is a discussion of three complementary techniques used to understand the spatial distribution of impurities in ice.
Raman spectroscopy uses the change in energy experienced by monochromatic incident photons interacting with a molecule’s vibrational modes to determine the chemical structure and, thus, the composition of a target. In ice analysis, Raman spectroscopy is used to determine the mineralogical composition of insoluble minerals throughout the volume of an ice sample. The output is precise information on the mineralogy of a particle at a well-defined location inside the ice, but no information is collected on soluble impurities (Stoll et al. 2022).
Scanning electron microscopy (SEM) and coupled energy dispersive X-ray spectroscopy (EDS) make use of both the secondary electrons and X-ray radiation emitted from a surface that an incident electron beam has bombarded. When used in tandem, the SEM and EDS techniques can be used to both spatially map the microstructure of ice and gain information on the composition of impurities simultaneously, but without quantifying the concentration of impurities present (Barnes et al. 2002).
Laser ablation inductively coupled plasma mass spectrometry (LA-ICP-MS) utilizes a brief laser pulse to ablate small volumes of material from a target’s surface. This material is aerosolized and transported to a mass spectrometer, where its elemental composition and relative concentration is determined. This process gives information on soluble and insoluble elements present in a target sample. By rapidly firing the laser over an area of a sample, high-resolution two-dimensional elemental maps, usually covering vertical cross-sections, can be generated. Figure 2 displays such data from an ice sample from Talos Dome, Antarctica (Bohleber et al. 2021). This image shows the impurities distribution on an ice sample’s surface at a resolution of 35 µm.
These techniques give complementary data on impurities, with the potential for retention of samples due to the non-destructive nature of Raman spectroscopy, joint SEM and EDS analysis, and the micro-destructive nature of LA-ICP-MS. By combining these approaches, a more comprehensive analysis of impurity location in ice can be achieved across different scales, encompassing both detailed particle-level information and broader spatial patterns.
Data processing
The application and improvements of the methods presented here are leading to the production of large amounts of high-quality data. Much like the data collection processes, data-analysis procedures are being adapted to process and interpret these data. Two-dimensional spatial data, such as the chemical LA-ICP-MS image shown in Figure 2, benefits greatly from analysis using automated computer image processing to perform tasks such as isolating the grain boundary network from an image, overlaying optical images over chemical images, and extracting crystal sizes (Binder et al. 2013). After extracting this information, the extensive range of spatial data embedded within these images can give valuable insights into particle compositions and impurity distribution across distinct regions of the ice matrix, allowing for a better understanding of chemical and physical processes occurring within the ice.

|
|
Figure 2: LA-ICP-MS elemental map showing the distribution of sodium on the surface of an ice sample. Note the strong association of sodium with the grain-boundary network, as seen in Figure 1, which shows an optical image of the same area. Figure generated from data presented in Bohleber et al. (2021). |
Outlook
The ice core due to be extracted from Little Dome C in Antarctica will form a continuous ice record beyond 1.5 million years ago, offering new insights into the past variability of our climate and the history of the Antarctic Ice Sheet. However, analysis of this exceptionally deep and old ice presents distinct challenges. The ice matrix and impurity record at such depths have undergone many changes during their journey down the ice sheet. The ice at the bottom of this core has thinned considerably, containing tens of thousands of years’ worth of variability within a single meter, meaning collection and interpretation of high-resolution data is crucial to fully capture the information within the core fully. Furthermore, the nature of this core as a unique archive and limited resource demands careful use. Therefore, any analysis should be high-resolution and non-destructive. Developments to the techniques discussed in this article are well-timed to give insight into the origin, composition, and location of the impurities within the core. This information will form a key part of our understanding of this exceptional climate archive.
affiliationS
1Department of Environmental Sciences, Informatics and Statistics, Ca’Foscari University of Venice, Italy
2Alfred Wegener Institute, Helmholtz Centre for Polar and Marine Research, Bremerhaven, Germany
3Department of Earth Sciences, University of Cambridge, UK
contact
Piers Larkman: piersmichael.larkman@unive.it
references
Barnes PRF et al. (2002) J Microsc 205: 118-124
Basile I et al. (1997) Earth Planet Sci Lett 146: 573-589
Binder T et al. (2013) J Microsc 250: 130-141
Bohleber P et al. (2021) The Cryosphere 15: 3523-3538
Rhodes RH et al. (2017) Atmospheric Chem Phys 17: 9417-9433
Stoll N et al. (2021) Front Earth Sci 8: 615613