- Home
- Publications
- PAGES Magazine
- The History of Volcanic Eruptions Since Roman Times
The history of volcanic eruptions since Roman times
Michael Sigl, J.R. McConnell, M. Toohey, G. Plunkett, F. Ludlow, M. Winstrup, S. Kipfstuhl and Y. Motizuki
Past Global Changes Magazine
23(2)
48-49
2015
Michael Sigl1,2, J.R. McConnell2, M. Toohey3, G. Plunkett4, F. Ludlow5, M. Winstrup6, S. Kipfstuhl7 and Y. Motizuki8
We discuss the timing of volcanic eruptions and quantify atmospheric sulfate loading using an array of ice cores from Greenland and Antarctica. We demonstrate that throughout the Common Era volcanic activity was the main driver for abrupt summer cooling in Europe.
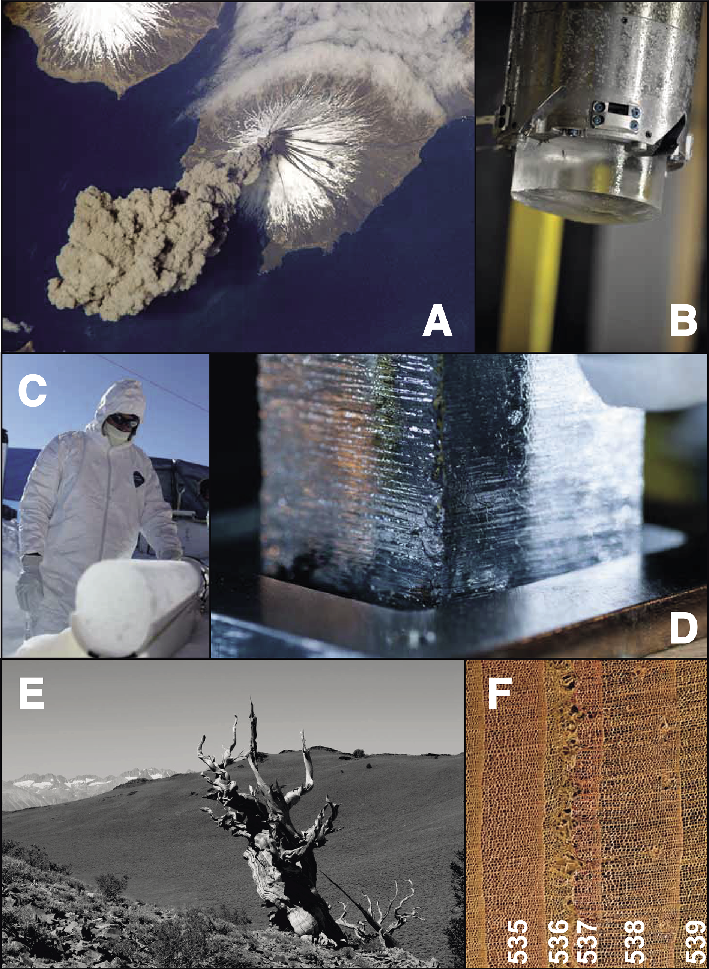
Volcanic eruptions impact climate through the injection of large amounts of ash and sulfur gas into the atmosphere (Fig. 1a). This gas is converted to sulfate aerosols, which reflect solar radiation in the stratosphere, decreasing the amount of solar radiation reaching the Earth’s surface. The primary result is a cooling of the Earth’s surface. Volcanic sulfate is mixed and transported within the stratosphere, and eventually travels downward into the troposphere, where it is finally deposited to the surface of the Earth. Sulfate deposition over the ice sheets is preserved in annually accumulating ice layers, allowing for reconstruction of the magnitude and timing of past volcanic events with the help of ice cores (Fig. 1b-d). The impact of volcanic eruptions is also clearly seen in other paleoclimate records. Temperature reconstructions predominantly obtained from tree-ring chronologies (Fig. 1e,f; Fig. 2) spanning previous centuries show the influence of a number of volcanic events (D’Arrigo et al. 2001; PAGES2k Consortium 2013; Salzer et al. 2014); however, a number of apparent mismatches between paleoclimate reconstructions and previously reconstructed volcanic forcing records have been noted (e.g. Mann et al. 2012). Striving towards better agreement between proxy-based climate reconstructions and model simulations is an important component of current climate research (Toohey et al. 2013). The paleoclimate record – i.e. reconstructions of past climate variables such as temperature and precipitation, produced from analysis of proxies such as tree rings, ice cores, and marine sediments – is essential for understanding the Earth system’s response to various forcing agents.
Sulfate measurements in ice cores
Because a major driver of climate variability over the past centuries is the impact of volcanic eruptions, the ability of climate model simulations to accurately recreate past climate is tied directly to the accuracy of the volcanic forcing time series used in the simulations. Presently, all volcanic forcing estimates used in paleoclimate model simulations is derived from ice cores. Time series of sulfate deposition from ice cores are translated into estimates of atmospheric sulfate aerosol loading, and corresponding estimates of radiative forcing. Volcanic forcing sets typically used in modern paleoclimate simulations span the years 500/800-2000 CE (Crowley and Unterman 2013; Gao et al. 2008), although the limited number of ice cores used to derive the forcing in the early years of the data set limits the accuracy of the estimated forcing (Sigl et al. 2014). The limited number of records currently included in volcanic forcing sets is explained by the time-intensive discrete measurement techniques that are often used to measure sulfate in ice. Newly developed state-of-the-art analytical techniques allow for a variety of elements (including sulfur) and chemical species to be analyzed simultaneously in real time while slowly melting the ice on a heated melter plate (McConnell et al. 2014; Fig. 1d). Further, the high measurement resolution of these analyses also allowed some ice cores from Antarctica with high annual snowfall rates to be dated by counting annual cycles in the impurity content of the snow and ice (Sigl et al. 2013).
A comprehensive array of ice cores from Antarctica
Methodological advances have enabled much more accurate reconstructions of the history of volcanic sulfate deposition in Antarctica over the last 2,000 years (Sigl et al. 2014). This has become possible by combining a number of new ice core sulfate records with pre-existing ones to provide better sampling over Antarctica, important due to the high spatial variability in sulfate deposition. The number of long-term records reaching back approximately 2,000 years has therefore been significantly increased compared with past compilations and this has meant a composite deposition index could be based on a quasi-static ensemble size over the length of the record. Also, the new record benefits from an improved timescale and better synchronization of the different ice core records; consequences of the very high temporal sampling resolution of the newly drilled West Antarctic Ice Sheet Divide Ice Core (WDC).
The new record of Antarctic sulfate deposition (Sigl et al. 2014) shows a number of improvements compared with previous reconstructions (Crowley and Unterman 2013; Gao et al. 2008). Firstly, the magnitude of a number of events is significantly adjusted, including a lessened estimate of the magnitude of the 1257 CE Samalas eruption. Secondly, the history of volcanism in the earliest centuries of the record is drastically altered, with updated dates and magnitudes of eruptions often differing greatly from prior estimates.
Revised ice-core chronologies
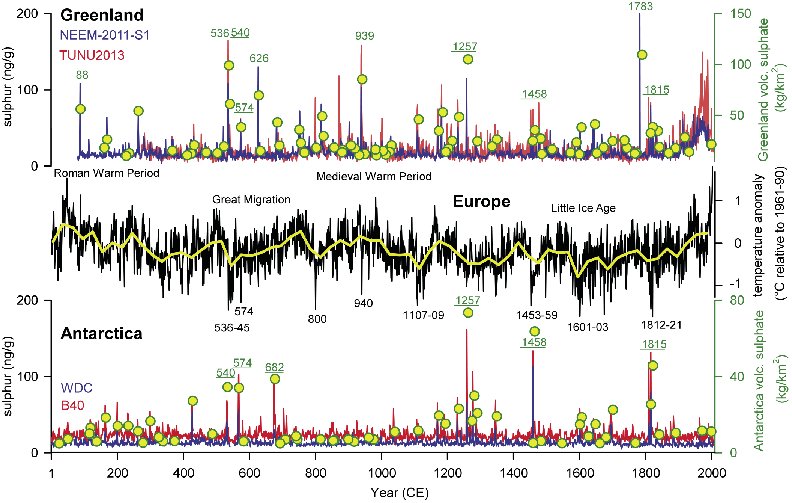
During the first millennium, inconsistencies were identified between the reconstructed timing of sulfate deposition on the ice-sheets and tree-ring records indicating widespread cooling. It was suggested that the ice-core chronologies were biased towards ages that were too old during that time, potentially caused by an incorrect link of the ice-core chronologies to the historic Vesuvian eruption in the year 79 CE (Baillie and Anneny 2015). By using a multi-disciplinary approach that integrates state-of-the-art continuous ice core aerosol measurements, automated objective ice-core layer counting (Winstrup et al. 2012), tephra and radioisotope (beryllium-10) analyses, and detailed examination of historical archives, we revised the ice-core chronologies for Greenland (NEEM-2011-S1) and Antarctica (WDC) and thus resolved these inconsistencies back into Roman times (Sigl et al. 2015). Other existing long-term sulfate records (e.g. those from NGRIP, GISP2, TUNU, DFS10, B40, NUS8-5) can be synchronized to the new timescales by matching their sulfate profiles (Fig. 2). This way, robust estimates of the ice-sheet mean deposition can be achieved (yellow circles in Fig. 2), allowing volcanic forcing to be estimated.
Post-volcanic summer cooling
With these revised ice-core chronologies, major volcanic eruption dates are in agreement with tree-ring reconstructed cooling extremes that occurred in the immediate aftermath of large volcanic eruptions throughout the Common Era (Fig. 2). The exceptionally cold summers reconstructed in parts of Europe (and other regions) in the years 1816, 1601, 1453, 1109, 574, and 541 CE all followed major volcanic eruptions, thus confirming that volcanic activity is an important driver of natural climate variability on inter-annual timescales. Strong summer cooling is not limited to tropical eruptions but is also observed frequently following eruptions located in the high latitudes of the northern hemisphere, as in the years 940, 800, and 536 CE. The largest volcanic eruption in terms of atmospheric sulfate loading (Samalas, 1257 CE) did not, however, appear to induce strong cooling in Europe. This confirms that for individual eruptions the temperature response to the forcing is spatially heterogeneous and may also be dependent on background conditions of the climate system such as the state of ENSO.
affiliations
1Laboratory of Radio and Environmental Chemistry, Paul-Scherrer-Institut, Villigen, Switzerland
2Desert Research Institute, Reno, USA
3GEOMAR Helmholtz-Zentrum für Ozeanforschung Kiel, Germany
4School of Geography, Archaeology & Palaeoecology, Queen’s University Belfast, UK
5Yale Climate & Energy Institute, and Department of History, New Haven, USA
6Department of Earth and Space Sciences, University of Washington, Seattle, USA
7Alfred-Wegener-Institut Helmholtz-Zentrum für Polar- und Meeresforschung, Bremerhaven, Germany
8RIKEN Nishina Center, Wako, Japan
contact
Michael Sigl: michael.sigl@psi.ch
references
PAGES-2k Consortium (2013) Nat Geosci 6: 339-346
Baillie MGL, McAneney J (2015) Clim Past 11: 105-114
Crowley TJ, Unterman MB (2013) Earth Syst Sci Data 5: 187-197
D'Arrigo R et al. (2001) Geophys Res Lett 28: 543-546
Gao CC et al. (2008) J Geophys Res-Atmos 113, doi:10.1029/2008jd010239
Mann ME et al. (2012) Nat Geosci 5: 202-205
McConnell JR et al. (2014) Sci Rep 4: 5848
Salzer MW et al. (2014) Clim Dyn 42: 1517-1526
Sigl M et al. (2013) J Geophys Res-Atmos 118: 1151-1169
Sigl M et al. (2014) Nat Clim Change 4: 693-697
Sigl M et al. (2015) Nature 523: 543-549


