Insights into paleoclimate modeling
Emma J. Stone1, P. Bakker2, S. Charbit3, S.P. Ritz4 and V. Varmav5
We describe climate modeling in a paleoclimatic context by highlighting the types of models used, the logistics involved and the issues that inherently arise from simulating the climate system on long timescales.
In contrast to "data paleoclimatologists" who encounter experimental challenges, and challenges linked to archive sampling and working in remote and/or difficult environments (e.g. Gersonde and Seidenkrantz; Steffensen; Verheyden and Genty, this issue) we give a perspective on the challenges encountered by the "computer modeling paleoclimatologist".
Simulating the physical interactions between atmosphere, ocean, biosphere, and cryosphere to explain climate dynamics is achieved through a large range of computer tools, from simple box models to complex three-dimensional (3D) fully coupled atmosphere-ocean general circulation models (GCMs) (see Box 1 for some examples).
Investigating the climate forcing and feedbacks that occurred during the past requires performing simulations on the order of thousands to tens of thousands of model years and due to computational time this is not easily achievable with a GCM. Therefore, compromises are required in terms of model resolution, complexity, number of Earth system components and the timescale of the simulation.
A suite of models referred to as Earth Models of Intermediate Complexity (EMICs) can effectively bridge the gap between computationally intensive GCMs and the box models (Claussen et al. 2002). These EMICs enable one to efficiently perform large ensembles and multi-millennial simulations whilst still retaining much of the behavior of a higher complexity model (e.g. Menviel et al. 2012; Ritz et al. 2011; Robinson et al. 2011). Although computing advancements have allowed transient climate experiments to be realized on long timescales, performing snapshot simulations with EMICs or GCMs is still frequent and useful (see Lunt et al. 2012).
Climate modeling by Past4Future
Within the Past4Future project numerous questions are addressed by modelers such as the sensitivity of climate to enhanced freshwater forcing, ice sheet changes and variations in solar and volcanic activity, using a range of EMICs and GCMs. Here, we highlight the implementation of multi-millennial transient simulations for the last interglacial period which include changes in astronomical and/or greenhouse gas concentrations (see Stone et al. this issue) using five climate models of varying degrees of complexity (see Box 1): CLIMBER-2 is a zonally-averaged model that permits basin-wide analysis, Bern3D includes a 3D ocean but a simple 2D atmosphere, LOVECLIM is of higher resolution (see Box 1), includes a low resolution GCM ocean but a simple three-layer dynamical atmosphere, FAMOUS is a low-resolution version of the UK Meteorological Office GCM (Gordon et al. 2000), and CCSM3 includes a fully dynamic atmosphere with the ability to be run at different resolutions (in this example the lowest resolution is used).
Although EMICs allow long time integrations to be easily realized, they parameterize a large number of processes (e.g. winds are fixed in Bern3D). The two GCMs, FAMOUS and CCSM3, have the advantage of including less parameterizations than the EMICs but they take months to run and generate large amounts of data. For instance, EMICs such as CLIMBER-2 and Bern3D have been able to simulate more than 800 ka in a few weeks. This is currently not achievable by models such as FAMOUS and CCSM3, which take several months to simulate only 10 ka.
 |
|
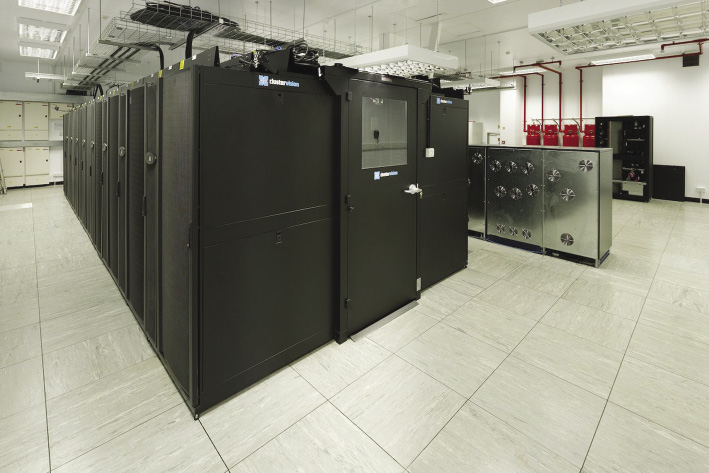
Figure 1: The machine room hosting the BlueCrystal supercomputer located in the Advanced Computing Research Centre (www.acrc.bris.ac.uk), University of Bristol (UK). Photo: Timo Kunkel. |
Not only should the computational time be considered but also the ability to actually run the model code on a computer in terms of the power and the financial expense involved. Typically, climate models are written in numerically efficient computing code (e.g. FORTRAN), which can be implemented on a local desktop computer, as is the case for the EMICs given in Box 1. Otherwise, computationally intensive codes are run using high performance computing facilities such as the German HLRN supercomputer (used by CCSM3) or the "BlueCrystal" cluster at the University of Bristol (used by FAMOUS), which has the ability to carry out at least 37 trillion calculations a second (Fig. 1). These supercomputers are inherently expensive to implement, e.g. the BlueCrystal facility initially cost seven million pounds, with ongoing developments, and continuous maintenance incurring future costs.
Maintaining and managing a climate model
Most model code is maintained centrally and in many cases can be downloaded freely by everyone. For example, the National Centre for Atmospheric Science looks after the FAMOUS model code in the United Kingdom and CCSM3 is maintained by the National Center for Atmospheric Research in the USA. Modelers from remote locations can submit new code but this needs to be peer-reviewed before being implemented into the next model version.
The EMIC models given in Box 1 comprise tens of thousands of lines of code while the GCMs contain more than half a million lines (see Easterbrook (2009) for details on the UK Meteorological Office model). Many individuals are involved in ongoing code modification and development, so version control is required to ensure errors are not inadvertently inserted. Good code development is also needed to ensure that any updates include clear and concise comments for users.
The technological development of increasing computer power, allowing climate researchers to run these multi-millennial simulations, large ensembles and GCM experiments, has presented a challenge with regard to what data should be written out and how it should be securely stored. The efficiency of some models such as CLIMBER-2, Bern3D and to an extent LOVECLIM, allows experiments to be repeated if more variables and different temporal resolutions (e.g. daily, monthly etc.) are required. This is not easily achievable with models such as FAMOUS and CCSM3. As such, careful decisions on what output would be useful are needed, not only for answering current research questions but also for long term future analyses, before the experiments are implemented.
The size of the output generated by the models in Box 1 varies greatly for a 10 ka simulation (depending on spatial and temporal resolution) from 400 MB to 6 TB. Normally, a sub-set of this data is stored on a storage facility that guarantees longevity and is ideally freely accessible. For example, the PANGAEA database (Data Publisher for Earth and Environmental Science; www.pangaea.de) is not only used for the secure storage of paleodata but also paleoclimate model results.
Closing remarks
The choice of a climate model has to be carefully considered in terms of included processes, the required spatial resolution, computational time and cost, the ability to obtain and run the model code and the storage space required for the model data. Although models are an incomplete representation of the Earth System, the advances in model development and computing technology over the last few decades have allowed researchers to consider more complex physical processes including a better understanding and consideration of the uncertainty in their model predictions (Hargreaves 2010). In the context of paleoclimatology this has greatly improved our understanding of the processes and feedbacks in the climate system.
Model |
Type |
Components |
Resolution |
Time to run 10 ka |
Main references |
CLIMBER-2 |
EMIC |
At; Oc; Si; Is; Ve |
10°×51°, 1 level (atm + land)2.5° x 20 levels (latitude-depth)Ice sheets: 40 km x 40 km |
~3 hours |
Petoukhov et al. (2000);Bonelli et al. (2009) |
Bern3D |
EMIC |
At; Oc; Si; Ve; Cc; Se |
~5°×10°, 1 level (atm+land)~5°×10 °, 32 levels (ocn + sea ice) |
~2-12 hours |
Müller et al. (2006);Ritz et al. (2011) |
LOVECLIM |
EMIC |
At; Oc; Si; Ve |
~5.6°×5.6°, 3 levels (atm + land)~3°×3°, 20 levels (ocn + sea ice) |
~15 days |
Goosse et al. (2010) |
FAMOUS |
Low resol. GCM |
At; Oc; Si; Ve; Cc |
5.0°×7.5°, 11 levels (atm + land)2.5°×3.75°, 20 levels (ocn +sea ice) |
~2 months |
Smith (2012); Smith et al. (2008);Williams et al. (2013) |
CCSM3 |
GCM |
At; Oc; Si; Ve |
~3.75°×3.75°, 26 levels (atm + land)~3.6°×1.6°, 25 levels (ocn + sea ice) |
~4-5 months |
Collins et al. (2006);Yeager et al. (2006) |
Box 1: Description of some of the types of climate models used in the Past4Future project. The following components are available in the models: Atmosphere (At), Ocean (Oc), Sea ice (Si), Ice sheet (Is), land surface with dynamic Vegetation (Ve), Carbon cycle (Cc) and marine sediment (Se). The At, Oc and Si components are used in the last interglacial model inter-comparison described in Bakker et al. (2013) but dynamic vegetation is switched off. Note that the models, which have approximate resolutions, use non-regular grids.
affiliations
1School of Geographical Sciences, University of Bristol, UK; show mail address
2Earth & Climate Cluster, Department of Earth Sciences, Vrije Universiteit Amsterdam, The Netherlands
3Laboratoire des Sciences du Climat et de l'Environnement, CEA Saclay, Gif-sur-Yvette, France
4Climate and Environmental Physics, Physics Institute and Oeschger Centre for Climate Change Research, University of Bern, Switzerland
5Center for Marine Environmental Sciences and Faculty of Geosciences, University of Bremen, Germany
references
Full reference list online under: pastglobalchanges.org/products/newsletters/ref2013_1.pdf
Bakker P et al. (2013) Climate of the Past 9: 605-619
Claussen M et al. (2002) Climate Dynamics18: 579-586
Easterbrook SM (2009) Computing in Science and Engineering 11(6): 65-74
Hargreaves JC (2010) Wiley Interdisciplinary Reviews: Climate Change 1: 556-564
Robinson A, Calov R, Ganopolski A (2011) Climate of the Past 7: 381-396