Reconstruction of the last interglacial period from the NEEM ice core
Dorthe Dahl-Jensen1, P. Gogineni2 and J.W.C. White3
We report new results from the NEEM ice core, a 2540-m-deep ice core recently drilled in Greenland. In particular, we present reconstructions of past surface temperature and elevation changes during the last interglacial at this new site.
Temperatures in the Arctic were high during the last interglacial period (LIG, 130-115 ka BP; Dahl-Jensen 2006; NorthGRIP Project members 2004; Turney et al. 2010) and mean global sea level was 6 to 7.5 m above the present level (Dutton and Lambeck 2012; Kopp et al. 2009). This strong warming must have caused the Greenland ice sheet and the Arctic ice caps and glaciers to retreat, and thus contributed to the global sea-level rise. Models of the Greenland ice sheet arrive at very different predictions of the volume and shape of the ice sheet during the LIG. The predicted mass loss varies between 0.5 and 5 m (e.g. Alley et al. 2005; Cuffey et al. 2000; Robinson et al. 2011). Here, we present results from the NEEM ice core that provide new constraints on surface temperature and elevation changes during the LIG in Greenland.
The NEEM ice core
A 2540-m-long ice core was drilled from 2008-2012 at the North Greenland Eemian Ice Drilling site (77.45°N, 51.06°W; Steffensen this issue). In 2010, the first measurements of water stable isotopes by online laser-spectroscopy in the field warned us that below 2200 m the ice was disturbed and probably folded. It was, however, also clear that the ice below 2200 m and older than 106 ka BP was from the LIG as the water oxygen stable isotope (δ18Oice) values were high (about -31.4 ‰). These measurements also indicated that below 2432 m, the ice was probably older than 130 ka BP and originated from a cold climate period.
 |
|
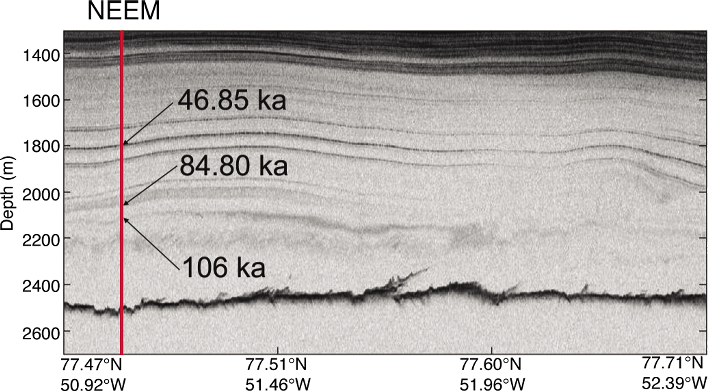
Figure 1: Center for Remote Sensing of ice Sheets (CReSIS) ice penetrating Radio Echo Sounding image from the NASA Operation IceBridge campaign 2011 showing a 48-km-long line crossing the deep drill site. The NEEM site is shown on the image and three dated horizons are marked. |
Figure 1 shows an image of Radio Echo Sounding along the ice ridge where NEEM is located. The surface and bedrock can be traced and internal layering can be dated at the NEEM site down to the disturbances at 2200 m. Below 2200 m the images show fuzzy and unclear reflections and the structures seem folded and disturbed. Disturbances of ice older than 100 ka BP are seen in nearly all the Radio Echo Sounding images from central and north Greenland and one should also note that both the GRIP and GISP2 ice core records are disturbed and folded below 100 ka BP (Suwa et al. 2006). The disturbances of the LIG ice in the GRIP, GISP2, and NEEM ice cores are believed to originate from to the rigid ice flow conditions caused by its low impurity concentration compared with the impurity concentration of the surrounding ice from glacial climate periods.
 |
|
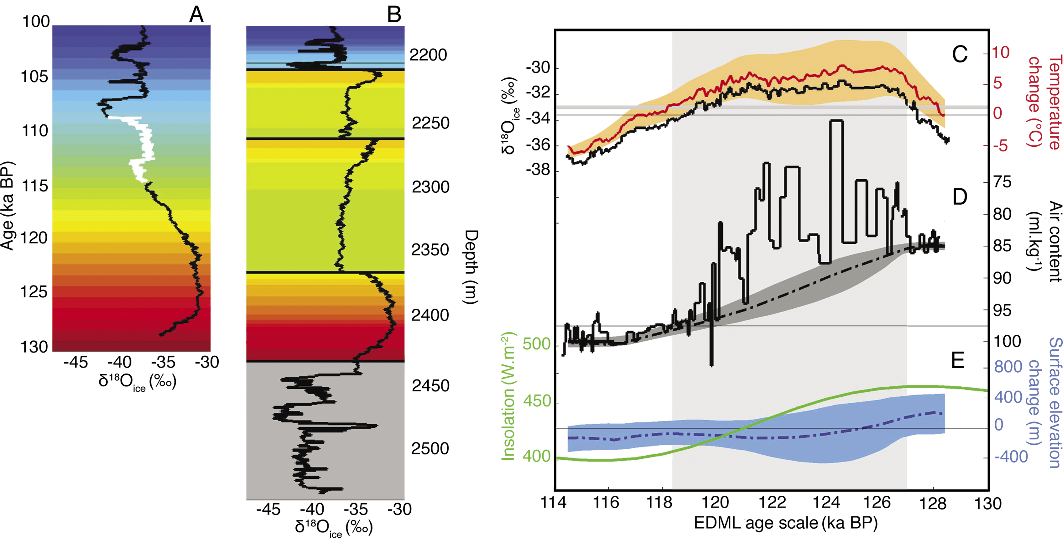
Figure 2: A) The reconstructed NEEM stable water isotope record (δ18Oice, black curve) including NGRIP data between 114-108 ka BP (white) on the EDML1 timescale. The time axis has been color-coded according to age. B) The color-coded dating is plotted with the original data on the NEEM depth scale in order to visualize the discontinuities and the reversed sections. C-E) Reconstruction of the temperature and elevation history based on the δ18Oice and the air content records during the LIG. C) Temperature change reconstruction (red curve) with associated errors (light red shading) and δ18Oice (black curve). The average present δ18Oice value of -33.6‰ is marked with a thin black line and the δ18Oice value of -33.0‰ is marked with a grey line as the limit where surface melt starts. D) Air content on a reversed scale. The soft dashed line was used to reconstruct elevation changes. E) When corrected for upstream flow and local summer insolation changes (green) the air content curve can be "translated" into elevation changes (blue, soft dashed) with the shaded zone indicating the uncertainty range. The zone with surface melt (127-118.3 ka BP) is shaded in light gray. |
The methane (CH4) concentration and the isotopic composition of oxygen (O2) measured in the air bubbles enclosed in the NEEM ice are global atmospheric tracers. Thus a chronological climatic sequence back to 128.5 ka BP can be obtained by comparing CH4 and δ18O of O2 measurements from the bottom section of the NEEM core with the records from other ice cores from Greenland (NGRIP) and Antarctica (EPICA Dronning Maude Land EDML) (NEEM community members 2013). Figure 2A presents the reconstructed δ18Oice profile on the EDML time scale from 100 to 128.5 ka BP. Figure 2B shows the measured δ18Oice record on the depth scale and indicates that the zone from 114 to 119 ka BP (green to yellow) is folded such that the records are mirrored and partly repeated three times, twice inverted. The zone from 2365 to 2432 m is undisturbed and contains the major part of the ice from the LIG (128.5-116.6 ka BP). We observe a hiatus in the NEEM record as no ice from 108 to 114 ka BP is found (values from the NGRIP record in white have been included in Figure 2A).
LIG elevation changes at the NEEM site
The air content in the enclosed air bubbles informs on past surface elevations, as lower air content is found when surface elevations increase. The new NEEM air content record is very noisy between 2370 m and 2418 m (gray shaded zone) and then drops to low values (Fig. 2D). It corresponds to the very warm part of the LIG where the δ18Oice values exceed -33 ‰ (Fig. 2C). Surface melt has certainly removed the air bubbles from the melting ice, resulting in regions with lower air content.
When corrected for the changing summer insolation and for elevation changes related to differences in the present position of the NEEM site and the depositional site of the LIG ice, surface elevation changes at NEEM can be calculated based on the air content record (Fig. 2E, blue curve) (NEEM community members 2013). Between 128 and 122 ka BP, the surface elevation decreases from 210 m above to 130 m below the present surface elevation, which translates into a moderate ice thickness change of 400 m after accounting for isostatic rebound. Based on this estimate, the ice thickness at NEEM decreased by an average of 7 cm per year between 128 and 122 ka BP and stayed at this level until 114 ka BP, long after surface melt stopped and when temperatures fell below modern levels.
The reconstructed elevation changes of only about 10% of the ice thickness at the center of the ice sheet points towards modest volume changes of the Greenland ice sheet during the LIG. While the documentation of ice thickness at one location of the Greenland ice sheet cannot constrain overall ice sheet changes during the LIG, our new results from the NEEM ice core only reconcile with Greenland ice sheet simulations (e.g. Robinson et al. 2011; Stone et al. 2012) that indicate a modest contribution of ca. 2 m to the observed ~ 6 to 8 m LIG sea level high stand (Dutton and Lambeck 2012; Kopp et al. 2009). Consequently, these findings strongly imply that Antarctica must have contributed substantially to the LIG sea level rise.
NEEM surface temperature changes over the LIG
Knowing the surface elevation changes during the LIG allows us to correct the measured δ18Oice values to a fixed elevation and, therefore, "translate" them into past temperature changes. The record is also corrected for the upstream and higher location of the depositional site of the ice from the LIG to produce a record at a fixed site and elevation. The record shows that Greenland temperatures peaked at the onset of the LIG (~126 ka BP), with surface temperatures 8°C warmer than at present at fixed elevation, and then gradually decreased thereafter during the LIG (Fig. 2C).
The reconstructed precipitation-weighted annual temperature changes are remarkably high. In general, warmer summer surface temperatures than those of the present are reported from paleorecords (Turney et al. 2010), with some records from high Arctic latitudes indicating surface temperatures at 126 ka BP as high as those reported from NEEM (Axford, et al. 2011). During the LIG the northern high latitude summer insolation reached a relative maximum at 128 ka BP (Fig. 2E) with values of 465 W m-2 exceeding the maximum values of the present interglacial (458 W m-2 at 11 ka BP). The LIG summer insolation, however, dropped rapidly, reaching values below present, e.g. 428 W m-2 at 121 ka BP. The onset of the LIG resulted in a short and intense warming associated with an ice thinning of about 400 m at NEEM. At 121 ka BP the intense and warm period was over and the temperature slowly declined while the ice thickness remained unchanged. These new results indicate that the anatomy of the LIG was different than that of the present interglacial, which is longer but not as intense.
Perspectives
Constraints on elevation and temperature changes in Greenland during interglacial periods can be found along the north-south ice ridge of the ice sheet where most of the deep ice cores have been drilled. The ability to constrain the Greenland ice sheet surface elevation and temperature history both through the Holocene (Vinther et al. 2009) and the LIG (NEEM community members 2013) provide useful "a priori" knowledge to be used by climate and ice sheet models.
In the framework of the Past4Future project, the ice sheet modeling group will use these recent constraints to improve the estimates of the contribution to sea-level rise from the Greenland ice sheet.
affiliations
1Centre for Ice and Climate, Niels Bohr Institute, University of Copenhagen, Denmark; ddj@gfy.ku.dk
2Center for Remote Sensing of Ice Sheets, University of Kansas, USA
3INSTAAR, University of Colorado, USA
selected references
Full reference list online under: pastglobalchanges.org/products/newsletters/ref2013_1.pdf
Kopp RE et al. (2009) Nature 462: 863-868
NEEM community members (2013) Nature 493: 489-494
Turney CSM, Jones RT (2010) Journal of Quaternary Science 25: 839-843
Stone EJ, Lunt DJ, Annan JD Hargreaves JC (2012) Climate of the Past Discussions 8: 2731-2776