Including dust dynamics in paleoclimate modeling
Yaping Shao
Knowledge about today’s climate-dust dynamics is the basis for the interpretation of dust deposition records. Regional climate models with built-in dust modules provide insights into dust transport out of the major source regions and facilitate direct comparison with sediment sequences.
Atmospheric dust loads have varied substantially over time (Maher et al. 2010), as revealed in dust records in ice cores (Lambert et al. 2008), deep-sea sediments (Winckler et al. 2008) and loess sequences (Ding et al. 2001). A key feature of Greenland and Antarctic ice cores is the pronounced dust load variations between glacials and interglacials, with more dust during glacials than during interglacials (Fischer et al. 2007). Deep-sea sediments also indicate high dust loads during glacial stadials; for example Moreno et al. (2002) found higher dust transport from the Sahara to the western Mediterranean during the cold stadial periods of the Dansgaard-Oeschger cycles.
Modern dust variability
 |
|
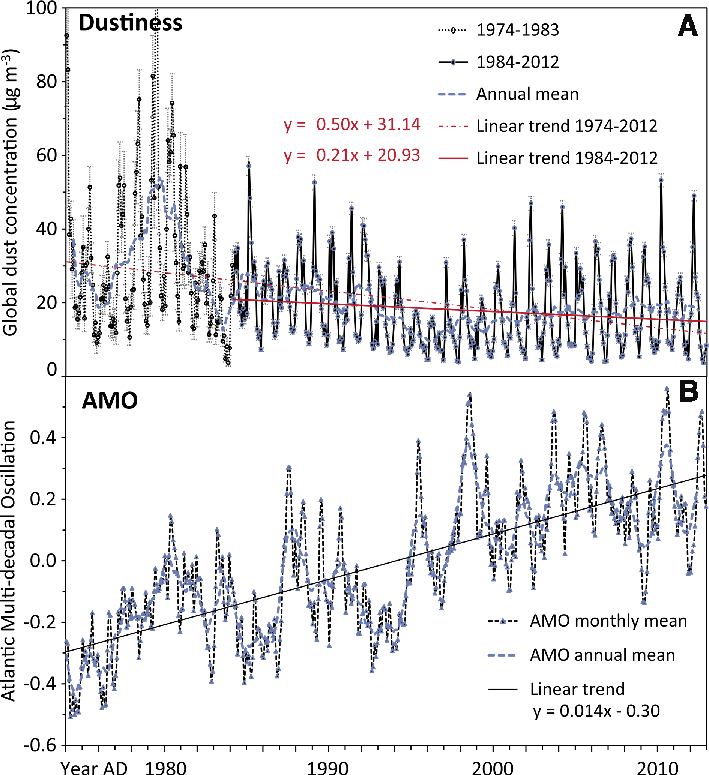
Figure 1: (A) Time series of global monthly-mean dust concentration, and the corresponding 95% confidence interval (in error bars), for the period 1974-2012, together with the yearly running mean and the linear trends. The trend for the full is shown by the dashed red line, for the period 1984-2012 by the solid red line. (B) Time series of the AMO index as monthly and yearly running mean, and showing the linear trend. |
Dust records reflect past climate changes in the form of varying deposition rates, particle size and dust mineralogy, but their interpretation is not straightforward. It is therefore important to understand the present-day climatic drivers of dust processes and their variability on different time scales. Using synoptic dust-weather and visibility data for the period 1974-2012, Shao et al. (2013) analyze recent dust trends and their link to climatic drivers. Figure 1a shows a series of the global monthly-mean dust concentration. For the period 1974-1983, the uncertainty in the dust concentration estimates is larger due to the smaller sample size (~20,000 month-1) relative to 1984-2012 (~300,000 month-1). The data analysis shows that dust concentration was in the order of 10-100 μgm-3 and decreased by about 0.2-0.5 μgm-3 per year over the past four decades. This trend is attributed primarily to decreasing dust production in North Africa and Northeast Asia.
Correlations have been examined between dust variability and key indices that affect climate variability in North Africa, including the Multivariate El Niño Southern Oscillation (ENSO) index (MEI), the North Atlantic Oscillation (NAO), and the Atlantic Multi-decadal Oscillation (AMO). The AMO is the main cause of tropical Atlantic sea surface temperature fluctuations and oscillates with a period of ~70 years (Goldenberg et al. 2001). A positive AMO phase corresponds to enhanced rainfall in the Sahel and above-normal hurricane activity over the Atlantic. Wang et al. (2012) used a dataset with records extending back to the 1950s and found multi-decadal co-variability between North Atlantic sea surface temperatures, African dust and Sahel rainfall (as well as Atlantic hurricanes). Low North Atlantic temperatures were accompanied by more African dust and less Sahel rain; high temperatures by less dust and more rain. The dust concentration time series for North Africa is significantly negatively correlated with the AMO index. This negative correlation has also been detected in several previous studies (Foltz and McPhaden 2008; Evan et al. 2012). No significant correlations were found between dust and MEI or NAO. This indicates that the present day global dust trend might be determined by the climate systems that govern variability in the Atlantic-North African region, i.e. mainly by the AMO. Regionally, the dominant drivers can however be different. Dust in Northeast Asia is more related to the Arctic Oscillation, while dust in Australia is primarily related to ENSO. Currently, there is not enough evidence to directly attribute the decreasing trend in dustiness over the last decades to global warming.
Dust modeling
Increased interest in dust has prompted rapid progress in dust modeling since the late 1980s. It began primarily with modeling dust transport, but has since grown to the point that comprehensive dust models have been developed and applied to all major dust regions around the world, in particular North Africa, Northeast Asia and Australia. Since the 1990s dust components were included in global climate models (e.g. Tanaka and Chiba 2006) by building dust modules into the model's atmospheric component. The central task of dust modeling in this context is to solve the dust budget equation for various particle size groups, including the computation of dust emission, transport and deposition.
 |
|
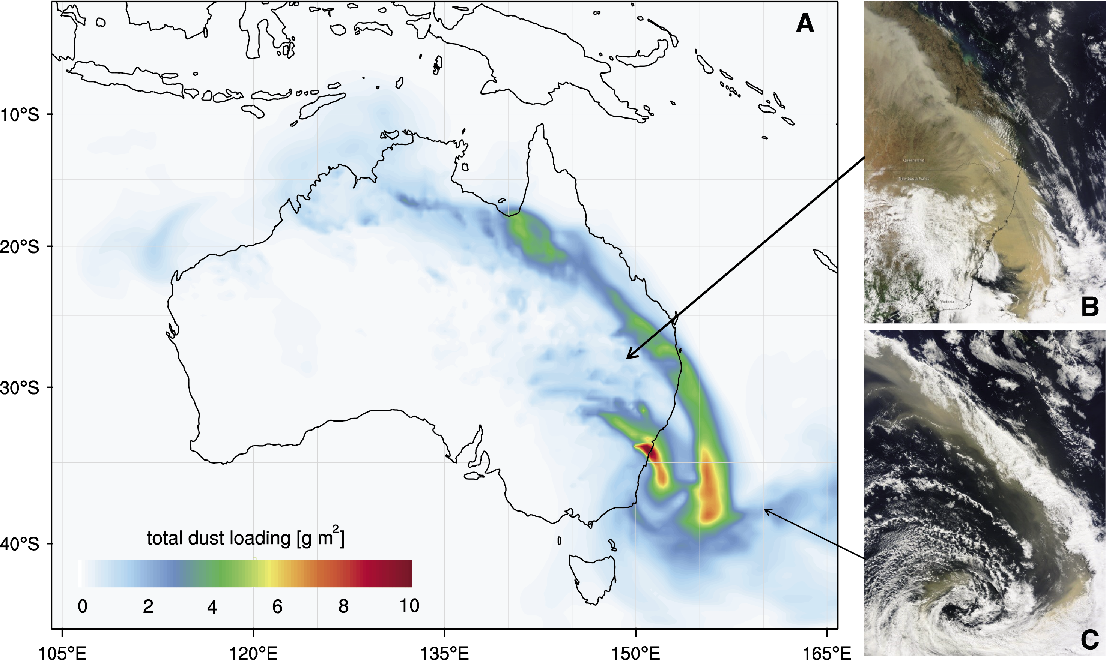
Figure 2: (A) Simulated dust load for the Australian dust event on 23 September 2009, using the WRF-CHEM/D model with a spatial resolution of 40 km. Australian dust is transported across the continent along two major routes: the southeast route along which dust is transported to the southern Pacific Ocean and the northwest route to the Indian Ocean. (B) MODIS satellite image from the morning of 23 September 2009. (C) As (B), but from 24 September 2009. The satellite images confirm the good performance of the model. |
Early dust models were not equipped with adequate dust emission and deposition schemes. In the late 1980s, dust emission schemes were developed based on wind erosion physics (e.g. Alfaro and Gomes 2001; Kok 2011) and more recently, measurements of size-resolved dust fluxes have become available for scheme validations (Ishizuka et al. 2014). Using these methods, dust simulations on continental scales have been quite successful. Figure 2 shows an example of the WRF-CHEM/D simulation of the Australian dust event of 23 September 2009, the strongest dust strom event on meteorological record, which swept over almost the entire Australian continent. Comparison with satellite observations shows that the simulation captured features of the dust event development and the dust distribution patterns well.
Present-day dust transport modeling provides information about dust dynamics as a basis for the interpretation of paleo-dust records. The particular example shown in Figure 2 suggests that Australian dust is transported across the continent along two major routes: the south-east route along which dust is transported to the southern Pacific Ocean and the north-west route to over the Indian Ocean.
Simulations of modern dust transport in North Africa revealed that Saharan dust is primarily transported towards the monsoon region in Western Africa by the northeasterly wind and then westward by the easterlies in the tropics (Klose et al., 2010). In winter, dust is transported mainly along a southerly route, while in summer a more westerly route dominates. The simulation of a typical dust event suggests that much of the dust transported to the tropical Atlantic originated from the northeastern part of North Africa (Libya, Egypt and Sudan). Dust emitted there was advected toward the Sahel dust zone and then transported westwards over the Atlantic. The Sahel dust zone exists in a climatic sense in terms of dust event frequency. It is located between 10 and 16°N, stretching several thousand kilometers over the Sahel from west to east, reaching the western boundary of the Ethiopian Highlands.
Finally, simulations in Northeast Asia revealed that the motion of the Mongolian cyclones and the cold air generally follow the East Asian trough. Dust from the Taklimakan and Gobi deserts is primarily transported toward the southeast and then the northeast. The Tarim Basin, in the Taklimakan desert, is no more than 1000 m a.s.l., but is surrounded by mountains of ca. 3000 m altitude. Dust is first lifted vertically by convection and basin-scale mountain-valley circulation to 8-10 km a.s.l. (see also Bory, this issue). Due to the strong westerlies in the upper atmosphere, the uplifted dust can travel more than once round the Earth (Uno et al. 2009).
Perspectives on paleo-dust modeling
Efforts are now being made to model dust in paleoclimate scenarios using Earth System Models (ESMs), such as those participating in the Paleoclimate Modeling Intercomparison Project Phase 3 (PMIP3; Otto-Bliesner et al. 2009). Within PMIP3, more than 20 GCMs/ESMs are run over 100 to 500 year periods centering on the Holocene, the Last Glacial Maximum and the Eemian Interglacial.
Regional climate models with built-in dust modules, such as the WRF-CHEM/D (Kang et al. 2011), were nested within the PMIP3 simulations to regionalize paleo-dust information and make comparison with sediment sequences easier. This should allow investigation of the dust patterns in North Africa during the Holocene and LGM. The outcomes of such model simulations are expected to strengthen the paleoclimatic interpretation contained in dust records. At present, this effort is confronted with the need for reconstruction of land-surface and regional climate and weather conditions. Our understanding of paleo land-surface conditions (e.g. soil type and vegetation cover), which ultimately determine the distribution and strength of paleo dust sources, is rather low. PMIP3 simulations generally have coarse spatial and temporal resolutions, which are insufficient for reliable paleo dust modeling. However, some progress has been made by use of techniques such as statistic-dynamic downscaling and ensemble simulations to reproduce paleo weather patterns for potential paleo dust regions.
affiliations
Institute for Geophysics and Meteorology, University of Cologne, Germany
contact
Yaping Shao: yshao@uni-koeln.de
references
Full reference list under: http://pastglobalchanges.org/products/magazine/ref2014_2.pdf
Evan AT et al. (2012) J Climate 25: 5817-5829
Ishizuka M et al. (2014) Aeolian Res 12: 87-99
Kang J-Y et al. (2011) J Geophys Res 116